Advanced Monitoring of Fluentd with Datadog and Rollbar : Part 2 : Visualizing & Alerting

(This post is part 2/2 in a series. For part 1, see: Part 1 : Instrumentation & Collection)

In part 1 of this series we went over how to instrument Fluentd so that it sends its errors and metrics to the monitoring services Datadog and Rollbar. In this post, we’ll cover how to effectively visualize and alert using those metrics.

Visualizing & Alerting with Datadog

Dashboard Template Variables

template-variables

Before jumping into the visualization themselves, it would be helpful to see how we have templatized the variables in our dashboards, so that one can quickly change the scope of all visualizations in that dashboard. For a complete guide on this powerful Datadog feature, see their Guide to Dashboard Templating.

Template variables we use:

  • $account-name: Account or environment name. Ex: “dev”, “stage”, “prod”, etc.
  • $realm: Twilio is a multi-region SaaS provider. Realm is analogous to the geographic region of a host. Ex: “usa”, “brazil”, “japan”.
  • $role: Functional type of the host. Ex: “mysql-master”, “mysql-slave”, “kafka”, “sms-sender”, etc.
  • $host: Host ID. We use an internal instance ID at Twilio, but AWS instance ID would also work.
  • $fluentd-tag: Thanks to the custom fluentd/dogstats instrumentation we built in part 1 of this post, we have metrics on bytes/sec and messages/sec tagged with their Fluentd tag. Ex: “nginx_access”, “nginx_error”, or “haproxy”.
  • $active: Load balancer state. Ex: “in-load-balancer” or “out-of-load-balancer”.

These template variables allow an operator to quickly modify all charts on a dashboard to visualize answers to questions like:

  • How much memory is being used by Fluentd in “prod” on all “mysql” hosts?
  • How much CPU is being used by Fluentd in “prod” by any 1 host?
  • How many “nginx_access” messages/sec are being sent in “prod” in Japan by all “kafka” hosts that are in-load-balancer?

Fluentd Bytes/Sec & Messages/Sec

02-bytessec02-messagessec

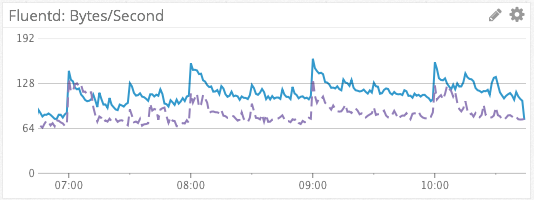
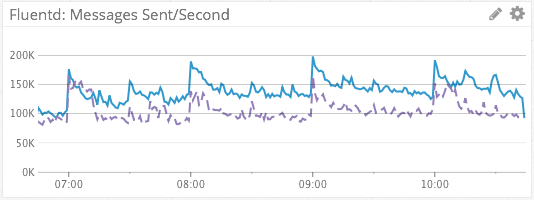
We visualize the sum of Fluentd bytes/sec and messages/sec across dimensions using the default, line graph visualization type, as rates. This simple, aggregated metric gives us a simple visualization of log message throughput. The dashed line in purple provides a week-over-week comparison, for context.

Fluentd Buffer Size

00-buffer-size-gb-by-role00-buffer-size-mb-by-host

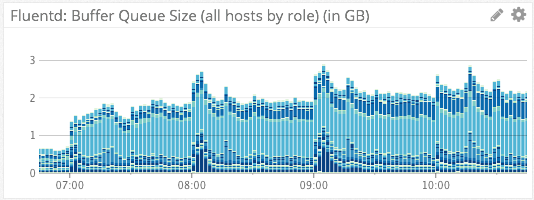
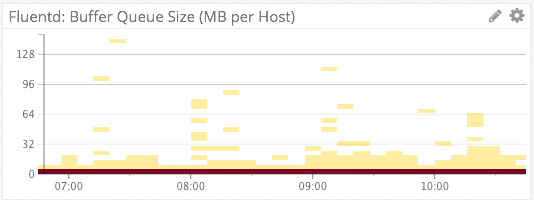
We visualize Fluentd’s on-host disk output buffer via the above two charts. The first chart uses the stacked bar visualization type, aggregated on “role”. The absolute height of each bar tells us the sum of all Fluentd disk buffers across an account. The individual components of each bar (the different shades of blue) each represent an individual role. From this we can quickly tell how much any individual role is contributing to the sum of all buffers.

The second chart uses the heat map visualization aggregated by “host”. Because Twilio operates thousands of instances in Amazon AWS, a line graph containing a separate series for each host would be far too noisy to derive any meaning from. This heat map visualization automatically scales from hundreds of hosts to thousands of hosts, while still maintaining the ability for an operator to derive meaning.

With regards to alerting, we have Datadog monitors setup to page us if the on-disk buffer of a given host reaches a critical threshold, or if the sum of all disk buffers across an account reaches a certain threshold. In our case, these alerts would be indicative of issues in forwarding log messages to AWS Kinesis.

Fluentd Retries

00-fluentd-retries-by-host-2

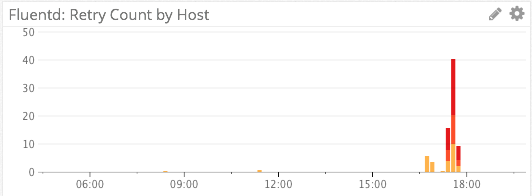
We specifically do not use a line graph for visualizing retries, as retries are relatively infrequent events and the line graph visualization would try to connect/interpolate points with lines.

Instead, we visualize Fluentd retries via a stacked bar graph. The absolute height of the graph shows us the number of retries, and each colored segment of the stack represents a distinct host.

A red color palette for the bars was chosen instead of the default blue color palette to indicate impending doom. 🙂

Fluentd CPU & Memory Consumption

01-fluentd-cpu01-fluentd-rss-memory

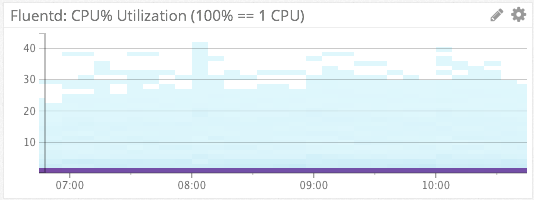
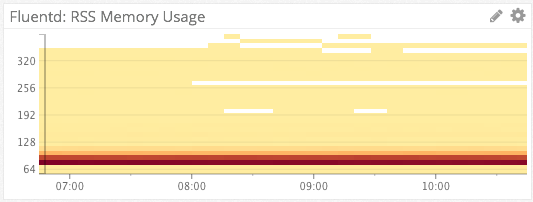
For Fluentd %CPU & memory consumption, we again turn the the heat map visualization type. Because each of these heat maps is aggregated by host, they can represent thousands of hosts in a simple chart. Ex: From the bottom chart we see that on the vast majority of hosts, Fluentd is consuming 70-90MB of RSS memory.

We have Datadog monitors setup to alert us via Slack if Fluentd is consuming >80% of a single CPU on any host, or page us via PagerDuty if Fluentd’s memory consumption becomes unreasonable.

01-fluentd-cpu-distribution

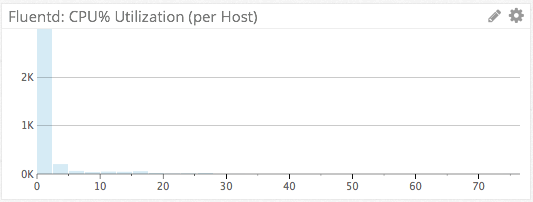
We can also use the distribution visualization type to view absolute numbers for the most recent sampling period. A distribution chart is basically a cross-section of the heat map chart rotated sideways, showing only a single period. This differs from the heat map in that a heat map shows evolution of the metric over time. Is this distribution, we can see that 2,000+ hosts have a Fluentd CPU utilization of <=5%, for the latest period.

Rollbar-Forwarder CPU & Memory Consumption

01-go-tail-rollbar-cpu01-go-tail-rollbar-memory

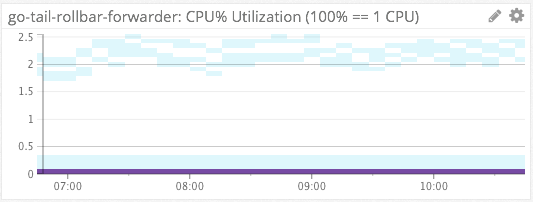
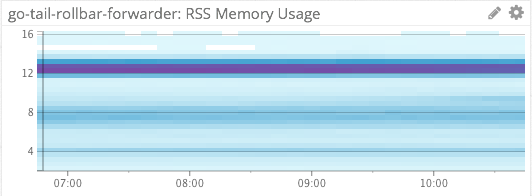
We similarly use heat maps to measure the %CPU and memory consumption of our file-tailing, rollbar-forwarder which is installed on each host.

Ingress vs Egress

04-fluentd_output_vs_bigquery_output_redacted

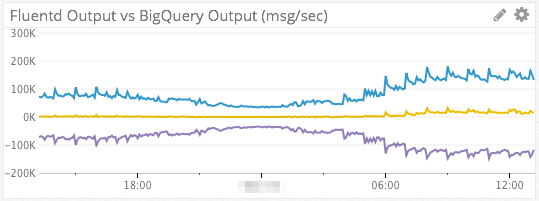
Since we use AWS Kinesis as a intermediate transport, it can be helpful to visualize data in-flow vs out-flow in order to determine where slow-downs in the data pipeline are happening.

The blue line in the chart above represents data flowing into Kinesis from Fluentd (ingress). The purple line at the bottom represents data read out of Kinesis by our Kinesis consumer (egress). The yellow line in the middle is a simple subtraction of the two series (B – A). If all is well and egress ~= ingress, then the yellow line should be right around 0.

The metrics for AWS Kinesis come from Datadog’s AWS integration.

Top Graphs & Change Graphs

04-most-active-logs-by-bytes

04-top10-roles-by-count

04-role-change-by-count

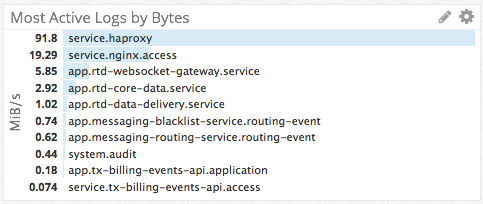
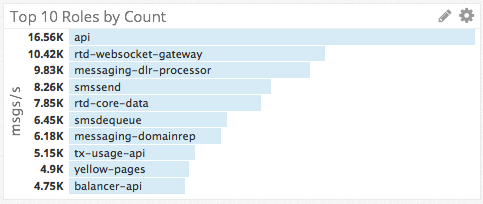
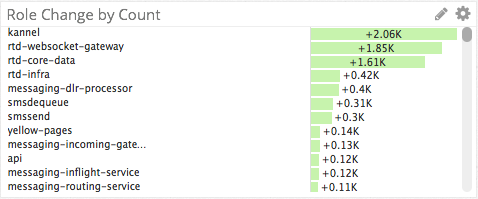
Thanks to the tags and dimensions we have applied to our metrics, we were able to create the top charts and change graphs to answer questions like:

  • What log file is the top source of log messages?
  • Which roles are the top producers of logs?
  • Which roles are contributing most to a sudden spike in log messages?

Alerting on Fluentd Issues with Rollbar

fluentd-rollbar

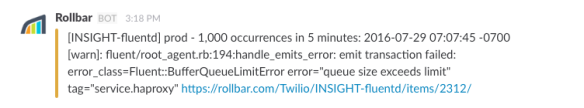
Using the go-tail-rollbar-forwarder app that I mentioned in part 1, we are able to get WARN/ERROR/CRIT log messages from Fluentd’s own log file into a SaaS service, so that we can be automatically notified about Fluentd issues. Other benefits of using Rollbar are that Rollbar will automatically aggregate and group similar messages from different hosts (see message about “1,000 occurrences…” above), and save us from having to log into machines to view Fluentd’s application log.

Since Rollbar was designed to be used by a logging library (Ex: log4j) and not as log aggregation service, we had to configure custom grouping rules to get Rollbar to group similar messages correctly. This was relatively simple to do using regex’s, but I mention it here for the sake of completeness.

Conclusion

I hope you found this guide on how to monitor Fluentd with Datadog and Rollbar to be helpful. If you’ve made it this far in the post, I’ll reward you by leaving you with some wisdom on monitoring:

Start with questions, don’t start with metrics.

If you start with metrics, the temptation will be to make a dashboard with a bunch of line graphs and call it a day. If you start with questions, however, you’ll be forced to work backwards and figure out if you even have the metrics, instrumentation, tags/dimensions, etc to be able to answer that question.

Ex: Using the metrics that we discussed in this post one could answer the question, “How many hosts are running Fluentd in my infrastructure?”. I guarantee you, however, that if you started with the raw metrics, you would never end up with a Datadog counter that showed you an absolute count of how many hosts are running Fluentd (Hint: Use “count(not_null(fluentd.messages.count{$host}))”). That is the value of starting with questions instead of metrics.

What are good ways to come up with insightful questions? One way that we came up with the questions that drove the creation of the charts in this post was through Chaos Game Day exercises. By practicing incident response in a controlled environment (ex: stage), we were able to learn what types of instrumentation and visualizations we needed in order to answer questions like, “Is the problem getting better or worse?” or “If the problem is getting better, what is the ETA until full recovery?”. When we did our first Game Day exercises we were not able to answer these questions, but in future simulations and real incidents, we were prepared!

If you don’t do Chaos Game Day exercises, ultimately you will have to learn in production when the real-deal incidents happen, and during your blameless post-mortems. The choice in how you’d like to prepare for these situations is yours.

redbug

Advanced Monitoring of Fluentd with Datadog and Rollbar : Part 1 : Instrumentation & Collection

(This post is part 1/2 in a series. For part 2, see: Part 2 : Visualizing & Alerting)

At Twilio, we use the open source log-forwarder Fluentd to forward billions of log messages per day from thousands of instances in Amazon AWS into Google BigQuery. Since the reliability of Fluentd is crucial to our operations, we have extensive monitoring and alerting around the Fluentd process running on each host. This blog post is a write-up of how we monitor Fluentd at scale, using both Datadog and Rollbar.

Datadog’s Builtin Integrations

Datadog provides several built-in, easy to setup integrations that we can use for monitoring Fluentd. Here are the two primary integrations that we use:

Datadog-Fluentd Integration

The Datadog-Fluentd integration provides several metrics from Fluentd:

  • fluentd.retry_count (gauge)
  • fluentd.buffer_total_queued_size (gauge)
  • fluentd.buffer_queue_length (gauge)

To setup this integration:

# /etc/fluent/config.d/src/source-monitor-agent.conf
---
<source>
  type monitor_agent
  bind 127.0.0.1
  port 19837
</source>


# /etc/dd-agent/conf.d/fluentd.yaml
---
instances:
  - monitor_agent_url: http://127.0.0.1:19837/api/plugins.json

init_config:

Datadog Process Check

The Datadog Process Check captures metrics from specific running processes on a system, such as CPU %, memory usage, and disk I/O. We can use this to monitor the CPU & memory overhead of the Fluentd process itself.

This integration is also very easy to setup. Just configure the Datadog agent (dd-agent) on your host(s) to collect stats on your Fluentd process:

# /etc/dd-agent/conf.d/process.yaml
---
instances:
- name: fluentd
  search_string:
    - /usr/local/bin/fluentd
  exact_match: 'False'

init_config:

If this integration isn’t working for you, you likely have the wrong process name listed for your Fluentd process. You can determine which process name the dd-agent would match against by running the following snippet:

#!/opt/datadog-agent/embedded/bin/python

import psutil

for proc in psutil.process_iter():
    print proc.cmdline()

Metrics on Messages/Sec & Bytes/Sec

While the above metrics for CPU, memory, buffer size, and retries are helpful, none of them allow us to answer one of the most basic questions one would hope to answer: How many messages/sec or bytes/sec of log messages is a given host (or cluster) forwarding?

In order to answer that operational question, we had to build a creative solution:

1. For all messages that are forwarded to our typical output destination (ex. AWS Kinesis, Google BigQuery, etc), use Fluentd’s built-in copy plugin to also send those messages to fluent-plugin-flowcounter. Fluent-plugin-flowcounter will then emit new messages with metrics for bytes/sec and messages/sec as key/value pairs under a new tag, ex: “flowcount”.

<match app.* system.* service.*>
  @type copy

  <store>
    @type flowcounter
    tag flowcount
    aggregate tag
    output_style tagged
    count_keys *
    unit second
  </store>

  <store>
    @type kinesis_streams
    ...
  </store>
</match>

2. Create a new match rule against those “flowcount” messages. This rule will duplicate each of those messages with new tags, “myproject.fluentd.messages.bytes” and “myproject.fluentd.messages.count”. We do this because metrics for bytes and message count must be submitted to Datadog as separate metrics.

#
# Match messages that came from the "flowcounter" plugin and duplicate them.
# The resulting messages should have different tags though, so that we can
# process them separately.
#
<match flowcount>
  @type copy

  #
  # Need to "deep copy", otherwise the <store>s below will share & modify
  # the same record. This is bad because we need to modify the new
  # "bytes"/"count" records separately.
  #
  deep_copy true

  <store>
    type record_modifier
    tag quantico.fluentd.messages.bytes
  </store>
  <store>
    type record_modifier
    tag quantico.fluentd.messages.count
  </store>
</match>

3. Create a filter rule to match “myproject.fluentd.messages.*” (both variants that we produced in step #2). Use the record_transformer plugin to transform the “fluentd.messages.count” messages into messages that simply contain the message count metric, and “fluentd.messages.bytes” messages into messages that only contain the bytes metric.

#
# Messages coming into here will have the form:
#
#     quantico.fluentd.messages.count: {
#         "count": 0,
#         "bytes": 0,
#         "count_rate": 0.0,
#         "bytes_rate": 0.0,
#         "tag": "syslog.messages"
#     }
#
# ... where metrics for both "bytes" and "count" are packed into the same
# message.
#
# Since the Datadog statsd plugin can only handle 1 metric/message, we must
# duplicate the flowcount message and tag the resulting messages for either
# "count" or "bytes", respectively.
#
# Those resulting duplicated events then come here for additional
# transformations:
#
#     * Add a new JSON key named "value", whose value is the respective
#       count/bytes value, taken from the key "count" or "bytes".
#     * Rename the key named "tag" into "fluentd-tag". This will result in a
#       Datadog metric-tag named "fluentd-tag" which we can then pivot on.
#       Ex: {"fluentd-tag": "system.messages"}
#     * Drop the original keys: "bytes,bytes_rate,count,count_rate". If not
#       removed, they would show up as distinct metrics tags in Datadog and
#       given that they would have values of varying sizes, this would cause
#       our number of tracked metrics (and associated $$ costs) in Datadog to
#       grow unbounded.
#
# The resulting messages will have the following format, which we can then
# <match> into the "dogstatsd" output plugin, for shipping off to the local
# "statsd":
#
#     quantico.fluentd.messages.count: {
#         "fluentd-tag": "system.messages",
#         "value": "20"
#     }
#
#
<filter quantico.fluentd.messages.*>
  @type record_transformer
  enable_ruby true
  remove_keys bytes,bytes_rate,count,count_rate,tag

  <record>
    value ${record[tag_parts[3]]}
  </record>
  <record>
    fluentd-tag ${record['tag']}
  </record>
</filter>

4. A final match rule to accept those “myproject.fluentd.message.*” messages, and emit them to the local dogstatsd process as a counter metric (XXX), which will then automatically forward the metrics to Datadog.

#
# Send messages like "quantico.fluentd.messages.count" to the local dogstatsd
# daemon.
#
<match quantico.fluentd.**>
  @type dogstatsd
  port 8125
  host localhost
  metric_type count
  flat_tags true
  use_tag_as_key true
  value_key value

  #
  # The default flush interval of all fluentd output plugins is 60 seconds
  # which is far too infrequent for dogstatsd, which flushes to the Datadog
  # service every 10 seconds. Without a shorter "flush_interval" here,
  # metrics in Datadog will only appear every 60 seconds, with 0's padded
  # in between each data point. Yuk.
  #
  flush_interval 5s
</match>

One thing to note about the message that is pushed to dogstatsd plugin, and our use of “flat_tags true”. For the sample message below, the dogstatsd plugin will convert “fluentd-tag” into a tag on the Datadog metric. This means that we will be able to aggregate our Datadog dashboards on Fluentd tags, and enable us to get metrics on specific log files. Ex: Count/bytes for “fluentd-tag” of “nginx.access”, “haproxy”, “system.messages”, or “*”!

quantico.fluentd.messages.count: {
    "fluentd-tag": "system.messages",
    "value": "20"
}

Monitoring Fluentd’s Log File Itself with Rollbar

A final issue that we thought of: The Fluentd process itself has a log file. What if Fluentd emits errors or exceptions on any of our thousands of AWS instances? How would we ever find out? We certainly couldn’t trust Fluentd to forward it own logs in these situations, so therefore we needed an external and independent destination for Fluentd’s logs.

To solve this problem, I wrote a small GoLang app called “go-tail-rollbar-forwarder” which does exactly what its name implies: It uses the hpcloud/tail library to efficiently tail files from the file system, and if it finds ERROR or CRIT messages, it forwards those messages to Rollbar, a software error-tracking SaaS (Sentry could also be used).

This being the first GoLang app I’d written of any significance, I also setup Datadog process checks to measure CPU & RSS memory metrics of this process. I’m delighted to say that after 8 months of running on thousands of instances, we’ve never had any problems with resource consumption of “go-tail-rollbar-forwarder”. According to our heat maps in Datadog, this process typically uses just ~12MB of RSS memory, and <1% of a single CPU.

The Next Steps

This guide covered how to instrument and collect metrics and error messages from Fluentd. In Part 2 of this guide, we will cover best practices around visualizing and alerting on those metrics and messages. On to Advanced Monitoring of Fluentd with Datadog and Rollbar : Part 2 : Visualizing & Alerting.

redbug

Encrypting Login Credentials in Ansible Vault

One of Ansible‘s benefits over Puppet and Chef is its server-less/agent-less architecture. Rather than having agents on client machines continuously checking in to a server for configuration changes (pull model), Ansible operates via a “push model” over SSH. One of the complications of the push model over SSH, however, is that the “pusher” needs to have login credentials to all of the target machines. Given that the set of these credentials are the collective keys to your kingdom, how can one store these credentials securely?

Ideally one would use SSH public/private key pairs for authentication. This assumes some of prerequisites though: 1) That the machine(s) you’ll be pushing from with the private key(s) are sufficiently locked-down such that the private key(s) will never be accessible to normal users; and 2) That each of your target hosts is configured with the corresponding public key as an authorized login key.

Suppose that you’re not yet able to fully implement public/private key pairs for authentication across your entire infrastructure. How should you proceed? Ansible’s docs on Inventory management indicate that one can put the login credentials in their inventory file. Ex:

[targets]
other1.example.com    ansible_connection=ssh    ansible_ssh_user=mpdehaan   ansible_ssh_pass=foobar
other2.example.com    ansible_connection=ssh    ansible_ssh_user=mdehaan    ansible_ssh_pass=foobar123

Unfortunately, here’s a dirty little secret about Ansible & Ansible Vault: The inventory file itself is not encrypt-able with Ansible Vault. If you proceed down the path of putting your login credentials into the plain-text Ansible inventory file in source control, anyone with access to your source control repo will have the login creds for all of the machines in your inventory. Ouch!

Luckily there is a solution for this: Buried deep within a page in Ansible’s documentation that describes Ansible’s support for Microsoft Windows, there is an example which provides a path forward for securely storing login credentials for machines managed by Ansible. The solution mentioned on that page is to use Ansible’s concept of “group_vars” and “host_vars” to store variables like “ansible_ssh_user” and “ansible_ssh_pass” on a per group/host basis, and then encrypt those variables with Ansible Vault.

Some examples:

# group_vars/webservers:
---
ansible_ssh_user: deployment
ansible_ssh_pass: my deployment password


# host_vars/db1.mycompany.com
---
ansible_ssh_user: ansible
ansible_ssh_pass: my other deployment password

From there one can encrypt those group/host variable files with “ansible-vault encrypt …”, and deploy with “ansible-playbook –ask-vault-pass …”.

For more information on Ansible Vault see their official docs, or my two-part blog post on using Ansible Vault:

ansible_logo_black_square

Automating Linux Security Best Practices with Ansible

Suppose you’re setting up a new Linux server in Amazon AWS, Digital Ocean, or even within your private network. What are some of the low-hanging fruits one can knock-out to improve the security of a Linux system? One of my favorite posts on this topic is “My First 5 Minutes On A Server; Or, Essential Security for Linux Servers“.

In that post Bryan Kennedy provides several tips, including:

  • Installing fail2ban – a daemon that monitors login attempts to a server and blocks suspicious activity as it occurs.
  • Modifying the configuration of “sshd” to permit neither “root” logins, nor password-based logins (ie. allow authentication with key-pairs only).
  • Configuring a software-based firewall with “iptables”.
  • Enabling automatic software security updates through the OS’s package manager.

These all seem like sane things to do on any new server, but how can one automate these steps for all of the machines in their infrastructure for speed, review-ability, and consistency? How can one do this in a way that allows them to easily modify the above rules for the different types of machines in their environment (ex. web servers should have port 80 open, but DB servers should have port 5432 open)? What’re some gotchas to be aware of when doing this? Here are my notes on how to automatically bring these security best practices to the Linux machines in your infrastructure, using Ansible.

Community-Contributed Roles which Implement the Best Practices

The first rule of automating anything is: Don’t write a single line of code. Instead, see if someone else has already done the work for you. It turns out that Ansible Galaxy serves us well here.

Ansible Galaxy is full of community-contributed roles, and as it relates this this post there are existing roles which implement each of the best practices that were named above:

Combining these well-maintained, open source roles, we can automate the implementation of the best practices from Bryan Kennedy’s blog post.

Making Security Best-Practices your Default

The pattern that I would use to automatically incorporate these third-party roles into your infrastructure would be to make these roles dependancies of a “common” role that gets applied to all machines in your inventory. A “common” role is a good place to put all sorts of default-y configuration, like setting up your servers to use NTP, install VMware Tools, etc.

Assuming that your common role is called “my-company.common” making these third-party roles dependancies is as simple as the following:

# requirements.yml
---
- src: franklinkim.ufw
- src: jnv.unattended-upgrades
- src: tersmitten.fail2ban
- src: willshersystems.sshd

# roles/my-company.common/meta/main.yml
---
dependencies:
  - { role: franklinkim.ufw }
  - { role: jnv.unattended-upgrades }
  - { role: tersmitten.fail2ban }
  - { role: willshersystems.sshd }

Wow, that was easy! All of Bryan Kennedy’s best practices can be implemented with just two files: One for downloading the required roles from Ansible Galaxy, and the other for including those roles for execution.

Creating Your Own Default Configuration for Security-Related Roles

Each of those roles comes with their own respective default configuration. That configuration can be seen by looking through the “defaults/main.yml” directory in each role’s respective GitHub repo.

Suppose you wanted to provide your own configuration for these roles which overrides the author’s defaults. How would you do that? A good place to put your own defaults for the configuration of your infrastructure is in the “group_vars/all” file in your Ansible repo. The “group_vars/all” file defines variables which will take precedence and override the  variables from the roles themselves.

The variable names and structure can be obtained by reading the docs for each respective role. Here’s an example of what your custom default security configuration might look like:

# group_vars/all
---
# Configure "franklinkim.ufw"
ufw_default_input_policy: DROP
ufw_default_output_policy: ACCEPT
ufw_default_forward_policy: DROP
ufw_rules:
  - { ip: '127.0.0.1/8', rule: allow }
  - { port: 22, rule: allow }

# Configure "jnv.unattended-upgrades"
unattended_automatic_reboot: false
unattended_package_blacklist: [jenkins, nginx]
unattended_mail: 'it-alerts@your-company.com'
unattended_mail_only_on_error: true

# Configure "tersmitten.fail2ban"
fail2ban_bantime: 600
fail2ban_maxretry: 3
fail2ban_services:
  - name: ssh
    enabled: true
    port: ssh
    filter: sshd
    logpath: /var/log/auth.log
    maxretry: 6
    findtime: 600

# Configure "willshersystems.sshd"
sshd_defaults:
  Port: 22
  Protocol: 2
  HostKey:
    - /etc/ssh/ssh_host_rsa_key
    - /etc/ssh/ssh_host_dsa_key
    - /etc/ssh/ssh_host_ecdsa_key
    - /etc/ssh/ssh_host_ed25519_key
  UsePrivilegeSeparation: yes
  KeyRegenerationInterval: 3600
  ServerKeyBits: 1024
  SyslogFacility: AUTH
  LogLevel: INFO
  LoginGraceTime: 120
  PermitRootLogin: no
  PasswordAuthentication: no
  StrictModes: yes
  RSAAuthentication: yes
  PubkeyAuthentication: yes
  IgnoreRhosts: yes
  RhostsRSAAuthentication: no
  HostbasedAuthentication: no
  PermitEmptyPasswords: no
  ChallengeResponseAuthentication: no
  X11Forwarding: no
  PrintMotd: yes
  PrintLastLog: yes
  TCPKeepAlive: yes
  AcceptEnv: LANG LC_*
  Subsystem: "sftp {{ sshd_sftp_server }}"
  UsePAM: yes

The above should be tailored to your needs, but hopefully you get the idea. By placing the above content in your “group_vars/all” file, it will provide the default security configuration for every machine in your infrastructure (ie. every member of the group “all”).

Overriding Your Own Defaults for Sub-Groups

The above configuration provides a good baseline of defaults for any machine in your infrastructure, but what about machines that need modifications or exceptions to these rules? Ex: Your HTTP servers need to have firewall rules that allow for traffic on ports 80 & 443, PostgreSQL servers need firewall rules for port 5432, or maybe there’s some random machine that needs X11 forwarding over SSH turned on. How can we override our own defaults?

We can continue to use the power of “group_vars” and “host_vars” to model the configuration for subsets of machines. If, for example, we wanted our web servers to have ports 80 &443 open, but PostgreSQL servers have port 5432 open, we could override the variables from “group_vars/all” with respective variables in “group_vars/webservers” and “group_vars/postgresql-servers”. Ex:

# "group_vars/webservers"
---
ufw_rules:
  - { ip: '127.0.0.1/8', rule: allow }
  - { port: 22, rule: allow }
  - { port: 80, rule: allow }
  - { port: 443, rule: allow }

===
# "group_vars/postgresql-servers"
---
ufw_rules:
  - { ip: '127.0.0.1/8', rule: allow }
  - { port: 22, rule: allow }
  - { port: 5432, rule: allow }

Rules for individual hosts can be set using “host_vars/<hostname>”. Ex: “host_vars/nat-proxy1.your-company.com”

# host_vars/nat-proxy1.your-company.com
---
# Allow IP traffic forwarding for our NAT proxy
ufw_default_forward_policy: ACCEPT

Ansible’s “group_vars”, “host_vars”, and variable precedence are a pretty powerful features. For additional readings, see:

Gotchas

There are a couple of “gotchas” to be aware of with the aforementioned scheme:

  1. Variable replacing vs. merging – When Ansible is applying the precedence of variables from different contexts, it will use variable “replacement” as the default behavior. This makes sense in the context of scalar variables like strings and integers, but may surprise you in the context of hashes where you might have expected the sub-keys to be automatically merged. If you want your hashes to be merged then you need to set “hash_behaviour=merge” in your “ansible.cfg” file. Be warned that this is a global setting though.
  2. Don’t ever forget to leave port 22 open for SSH – Building upon the first gotcha: Knowing that variables are replaced and not merged, you must to remember to always include an “allow” rule for port 22 when overriding the “ufw_rules” variable. Ex:
    ufw_rules:
      - { ip: '127.0.0.1/8', rule: allow }
      - { port: 22, rule: allow }

    Omitting the rule for port 22 may leave your machine unreachable, except via console.

  3. Unattended upgrades for daemons – Unattended security upgrades are a great way to keep you protected from the next #HeartBleed or #ShellShock security vulnerability. Unfortunately unattended upgrades can themselves cause outages.
    Imagine, for example, that you have unattended upgrades enabled on a machine with Jenkins and/or nginx installed: When the OS’s package manager goes to check for potential upgrades and finds that a new version of Jenkins/nginx is available, it will merrily go ahead and upgrade your package, which in-turn will likely cause the package’s install/upgrade script to restart your service, thus causing a temporary and unexpected downtime. Oops!
    You can prevent specific packages from bring automatically upgraded by listing them in the variable, “unattended_package_blacklist”. This is especially useful for daemons. Ex:

    unattended_package_blacklist: [jenkins, nginx]
    

Conclusion

Ansible and the community-contributed code at Ansible Galaxy make it quick and easy to implement the best-practices described at “My First 5 Minutes On A Server; Or, Essential Security for Linux Servers“. Ansible’s notion of “group_vars”, “host_vars”, and variable precedence provides a powerful way for one to configure these security best-practices for groups of machines in their infrastructure. Using all of these together one can automate & codify the security configuration of their machines for speed of deployment, review-ability, and consistency.

What other sorts of best-practices would be good to implement across your infrastructure? Feel free to leave comments below. Thanks!

ansible_logo_black_square

Succeeding through Laziness and Open Source

Back in mid-2014 I was in the midst of Docker-izing the build process at Virtual Instruments. As part of that work I’d open sourced one component of that system, the Docker-in-Docker Jenkins build slave which I’d created.

docker-meme

While claiming that I was driven by altruistic motivations when posting this code to GitHub (GH) would make for a great ex-post narrative, I have to admit that the real reasons for making the code publicly available were much more practical:

  • At the time the Docker image repositories on the Docker Hub Registry had to be tied to a GitHub repo (They’ve added Bitbucket support since then).
  • I was too cheap to pay for a private GitHub repo.

… And thus the code for the Docker-in-Docker Jenkins slave became open source! 😀

Unfortunately, making this image publicly available presented some challenges soon thereafter: Folks started linking their blog posts to it, people I’d never met emailed me asking for help in getting set up w/this system, others started filing issues against me on either GH or the Docker Hub Registry, and I started receiving pull-requests (PRs) to my GH repo.

Having switched employers just a few months after posting the code to GH, dealing with the issues and PRs was a bit of a challenge: My new employer didn’t have a Dockerized build system (yet), and short of setting up my own personal Jenkins server and Dockerized build slaves, there was no way for me to verify issues/fixes/PRs for this side-project. And so “tehranian/dind-jenkins-slave” stagnated on GH with relatively little participation from me.

Having largely forgotten about this project, I was quite surprised a few weeks ago when perusing the GH repo for Disqus. I accidentally discovered that the engineering team at Disqus had forked my repo and had been actively committing changes to their fork!

Their changes had:

  • Optimized the container’s layers to make it smaller in size,
  • Updated the image to work with new versions of Docker,
  • And also modified some environment variable names to avoid collisions with names that popular frameworks would use.

Prompted by this, I went back to my own GH repo, looked at the graph of all other forks, and saw that several others had forked my GH repo as well.

One such fork had updated my image to work with Docker Swarm and also to be able to easily use SSH keys for authenticating with the build slave instead of using password-based auth.

“How cool!”, I thought. I’d put an idea into the public domain a year ago, others had found it, and improved it in ways that I couldn’t have imagined. Further, their improvements were now available for myself and others to use!

My Delphix colleague Michael Coyle summed this all up very nicely, saying “As a software developer I can only realistically work for one organization at a time. Open source allows developers from different organizations to collaborate with each other without boundaries. In that way one actually can contribute to more than one organization at once.”

In hindsight I’m absolutely delighted that my unwillingness to purchase a private GitHub repo led to me contributing the Docker-in-Docker Jenkins slave to the public domain. There was nothing proprietary that Virtual Instruments could have used in its product, and by making it available other organizations like Disqus, CloudBees have been able to benefit, along with software developers on the other side of the planet. How exciting!

Managing Secrets with Ansible Vault – The Missing Guide (Part 2 of 2)

(This post is part 2/2 in a series. For part 1 see: Managing Secrets with Ansible Vault – The Missing Guide (Part 1 of 2))

How to use Ansible Vault with Test Kitchen

Once you’ve codified all of your secrets into Ansible “var files” and encrypted them with Ansible Vault, you’ll probably want to test the deployment of these secrets with Test Kitchen. Unfortunately you will quickly find that Test Kitchen does not play with Vault in an ideal way: In order for Test Kitchen to run “ansible-playbook” it now needs the password to your Vault in order to decrypt the secrets within the var files.

How does the “kitchen-ansible” plugin expect to receive the password to your Vault? Via a plain-text file on your filesystem, as specified by the “ansible_vault_password_file” parameter in your “.kitchen.yml” file. Oh boy!

This does not seems like a scalable solution to me… I hardly trust myself to manage a plain-text file with the password to our Vault. Beyond that, I would be terrified to let an entire organization of folks know the password to the Vault and instruct them to store that password in a plain-text file in their own respective file systems just so that they could run Test Kitchen tests as they iterate w/Ansible. In practice this would be only marginally better than simply checking in the secrets as plain-text into git, as all this structure around Vault and Ansible vars would only be pushing the problem of secret management one level higher.

So how can we test with Test Kitchen when using Ansible Vault? Here’s a nifty solution to the problem that builds upon the solution that we implemented in Part 1 of this guide:

  • Define a well-known Unix hostname for your Test Kitchen VM. Ex: “test-kitchen”
  • Create two versions of your vars files: One for production which is encrypted, the other for your test environment which is unencrypted. The structure of the files will be largely the same (ex. the files to be placed, w/their respective owner, group, mode), but the contents of the files for production will differ from the files for your test environment.
  • In “tasks/main.yml”, use “include_vars” to include the appropriate var file for whichever environment you happen to be in. This can be done by using the “with_first_found” arg to “include_vars”. See example below.
# .kitchen.yml
---
# Set the hostname of our Test Kitchen-created VM to be “test-kitchen”
driver:
  name: vagrant
  vm_hostname: test-kitchen
...<snip>...

##########

# vars/vpn-secrets-prod.yml - A Vault-encrypted file
$ANSIBLE_VAULT;1.1;AES256
34336333316361306432303864336464623165316461396266626562393232316565383263663234
3963633535363737613136656535343436613335636663380a373766653966663337666539613166
32313738303263303130353665333031373930353938653766653732623061326462633065393134
3135386639333637630a393439343733616439373731383932383562356164633832363639636633
64373237333661653066346566366135326539636564343632666363663866653264396564396162
62353461326435373433633034313338376265396130363965313464656332373737306462323433
34646361363065656331336337313763313939303533646138323834336330323533353239363663
...<snip>...

# vars/vpn-secrets-test-kitchen.yml
---
vpn_secret_files:
  /etc/openvpn/easy-rsa/keys/ec2-openvpn.key:
    owner: root
    group: root
    mode: "u=r,go="
    content: |
      -----BEGIN PRIVATE KEY-----
      MIIEvAIBADANBgkqhkiG9w0BAQEFAASCBKYwggSiAgEAAoIBAQD5koXgI24E360f
      nhxCfOPVORzFW1CN7u/zOQdvKoIStogF0UQifDCnY/POEjoBmzBrg/UyAmsqLIli
      xMtRIuvEhwaGEUQPoZNCaRW+1XtJ3kDvr9MVTlJTcNGOlGe/E+HyAKBq5vinxzzM
      9ba8M9Nc1PQ93B1OTUY1QGHVYRvSFYDJ5Fnz23xKeNsnY3hmRkV7CDZXSdy9nbmy
      1X9uz7z5bG7PKUVD3JZjI75CHAEDJKtscBv9ez/z16YTxwahIL3CXfqBq8peyAZ0
      n4Mzj4Lt8Cwaw2Kw3w3gMhbhf4fy284+hYqHe9uqYJC6dJJSKDIXqoLSD+e8aN+v
      BAEQcAWXAgMBAAECggEAbmHJ6HqDHJC5h3Rs11NZiWL7QKbEmCIH6rFcgmRwp0oo
      GzqVQhNfiYmBubECCtfSsJrqhbXgJAUStqaHrlkdogx+bCmSyr8R3JuRzJerMd6l
      Jd3EJHZBnzoU1VT6Fd77Xge868tASySp1ZUPv2nEoBhn9jw2kf1HgiH5o2CR53ZP
      pnL72Ng7MHpKuyoAZ9DtUU7yGG4RTCN2JuPGD6IwKoXBs1b7tqsMncz86u6Iibwk
      Np4j3vPmSLfQxvBP85T0xzSURlnP+bFCaJDPfXYIgDLROkrFAgJ2ADCm4gwfk93i
      Z/wnk8tFjnxUy2V5UbtWqqkVHmvdHHCc/6bZfcNOsQKBgQD/v94YX3vhgZRiz1kZ
      c0v2lxFZqNgMPC7EADmO34nFq7KtmVXYQfpoiooGDfQXTqfVGQsyTcpg5HLZvlyb
      qm9oaXpZY4yP/SLF6Pc00/iDTleSxGROyqhsaBotXpqSSC3rv92D9Zas/Xdz3lHD
      NSY9EVsiFId7O4OkvLuZVDvZQwKBgQD50Rs873/yUdyCwKx9/GF4yWVRg7//FTyQ
      Cj1KCBK5tDqOc+hiIS1GF0HRkcvIot71owTe+PG9OouXlUuxWrtc+fzgGSPaYjMp
      Ub69EcSNtUsK8MUS+VADbR5VDzS27OM1g+pJO7BbHpPWuEI1cjYmW/+3cCzFYnIV
      5z6OctbjHQKBgEVQWP8+EbMijXbiP4G4T+Q7OUaVjkhynzIb5X2ldA+Q41JNdoiw
      CRAATDwr1/XhKXeF3BT8JFdyUvZUs4C1BpDD1ZcYdeYocx40b5tvv7DGsNFkTNNV
      9aO76yxUsYvn6Bo22/CBxR6Ja7CJlptTclOmuo5YBggOLzWcuTNrMvVFAoGASIoV
      lK4ewuhOVZFJBRRB4Wbpiq/tEk7CVTkD7vlFJrNUxYSWl9f2Y4HhVM83Ez1n7H+3
      rF8xIrdbTVrGresguLDGYvQp2wHkxTy9W/1Ky7M25ShgsU+/kh8fTaeqsOs8Vo/F
      ehpg7TSFzTWX1Bkj7COOr19dQLuDUSTin05tY2kCgYB35ZHVDMR6TlW0Kp/l7gAx
      FQx5hojllzHr3RRv8a4rBbhsdAJGBr5QHZbzVeuw1z6NlDc/4brer3y52FnnHbD3
      fkUrvh+g1xHeXF4Yekr5Mu2D7PoQoFRRai2hjPnIHRLmHI45EPri3USoHuNPl+qB
      l23chS70zQ9VDmqEs9gjLA==
      -----END PRIVATE KEY-----
  /etc/openvpn/easy-rsa/keys/ca.key:
    owner: root
    group: root
    mode: "u=r,go="
    content: |
      -----BEGIN PRIVATE KEY-----
      MIIEvgIBADANBgkqhkiG9w0BAQEFAASCBKgwggSkAgEAAoIBAQDPm22e2QTeTnLN
      PT//6kyB8tM/2kE6+LsFD3TFA4XvS3gwNZLybjXpPtncF4qLxjq3c4uSBp2tuAa2
      VvWUCAyQX4EcOuCFhh1AIUHX9O4F2JhLtNH366D6LmfGE7Lck85R6bzErYJ5OzBN
      /3WSGtWmLbQWhXTvNwG5re17Ds7DLQ6/XRXCg91lAbtGqYCvw9F6X8N3VNdcovqN
      Ud+tJ4XjmGfPD8ZgSk/iVKeLzz5fuNxON+ygdUJ9IQJGu7kvJOhWD1F3p3lzuS4E
      7zyR8r9QK6lGdk2/ifmY5f+tmI92fvVl2HD2DroEVp42hCYEpNogm8BKXHFHBA9N
      0mugGMzVAgMBAAECggEAAK5a2rWNjYkmWUQFLLrBC4AXb1Mw+ZeNTYPydx7+1n0h
      5M6YL9Fqvdwl7NHq83BwCuAHKjB5XfOHmhuI7LZmDCc0DjqnN+jruaUiSSoVidFf
      Foh+U9jjC08RqhWwdYbKm3wv0VlcXzdxfiADa7pIzyXBPH2tl4dPqyNF7yxqQzum
      F42D4IExbYYkGR7bP6RePrUiaO3iU/EwDL5Dey4+93K+EaxbdxIhMLclvnQ8I0tl
      tFGn4AbbOqPqzPxWZhWk2gT//jMTtJh6FxQLQkvDoEnta5UYQ2E38r33jK+Wasga
      lGZEyNOTMq1MMdPrCzXloJSnerCXC4vTFt62AOdIQQKBgQD3SvUeaXV7Xf67vL0t
      EdBG9YL0Zz2MxxoVAth44svMzQ4gR6/pkakEhMzR51I/Skl/wzCJFHY1Z4nq9DoA
      RY5APjO63uHdZEKKYZ1MTXmO6F+IkUY5MCBvyCtLsnkAcToyuyDuhV4NBfjydw6E
      L5S1H9NI7klvaPxq5I7KkzSeJQKBgQDW6sDBvi6ctV3w8GCTUjP5Ker1FuKYL7Yn
      HI6RIGnWB2hS8NbEe8ODgzsVOVnC6x+WCNBiu/GmF8wlue7PCH7rLEa8diiM+J9/
      QYXtezfLIhPqhPJZDj5IX7bIotkvUzv+ywvUfCtJ3aCAu8DMi09x1GRgU6go/4ZK
      SCmVmj588QKBgQCNhr2gCRTuZM37nbnayF4drjajL06/eddIfRdsn8epTxWtjbl0
      gCNt7Z7W5n9gr2A/GXN2kFpSmA4LhHiJXUVbKP4sDZDQRqf6UIFYgOJ30i+SlinN
      Yui9cJ6utNahVSvMiuH/AB7iby+ZfF+3cQ+3VR5zl8Q5WalUd7fs4bB0bQKBgBI1
      x+lipO5wS6pro7M35uF41Mi5jK+ac1OzDr1rQqx46jUE5R224uUUzH/K4Tkr1PxQ
      eN+0zw/kuk6EB6ERNjfVA5VaaaswMcuFkMSDiUGz/H4Fj8dN9qcJPSKY8dAZvF6l
      c7YoYz6aAcyGnBp4v12EwpCK5he7NvS6UpOzgxHxAoGBAOjiBQtwikKLzLYwg1gF
      QYh1TLvEJIRFYEFQveVUKxmSskN4W6VQrTrcqobYHM9tOSbSe+Ib/y/khpaEz0PE
      E5gxeUbxhTj0PVvOKJmyCKWDPL8o61MGVhX1nAJarfbdP1XM9fl4S3pZH14bIhOU
      FG0e4jNsDq6vdwytV9R/GyAv
      -----END PRIVATE KEY-----

#######

# tasks/main.yml
#
# Leverage the fact that our ".kitchen.yml" file is setting the hostname of
# test VMs to "test-kitchen". Using "with_first_found" we can load the
# unencrypted "vpn-secrets-test-kitchen.yml" for test VMs, otherwise load the
# Ansible Vault-encrypted "vpn-secrets-prod.yml" file.
#
# Use "no_log: true" to keep from echoing the key contents to stdout.
# See: http://docs.ansible.com/faq.html#how-do-i-keep-secret-data-in-my-playbook
#
- name: VPN Server | Load VPN secret keys
  include_vars: "{{ item }}"
  no_log: true
  with_first_found:
    - "vpn-secrets-{{ ansible_hostname }}.yml"
    - "vpn-secrets-prod.yml"

- name: VPN Server | Copy secret files
  copy:
    dest="{{ item.key }}"
    content="{{ item.value.content }}"
    owner="{{ item.value.owner }}"
    group="{{ item.value.group }}"
    mode="{{ item.value.mode }}"
  with_dict: vpn_secret_files
  no_log: true
  notify:
    - restart openvpn

The magic lies in the “with_first_found” argument above. In the Test Kitchen environment “vpn-secrets-{{ ansible_hostname }}.yml” will interpolate to “vpn-secrets-test-kitchen.yml” because of our well-defined hostname. Since this “vpn-secrets-test-kitchen.yml” file exists in unencrypted form under “vars/”, Ansible will grab that var file for your Test Kitchen environment. If the hostname is something other than “test-kitchen” (ie. production), then Ansible’s “with_first_found” will reach the “vpn-secrets-prod.yml” var file, which is encrypted with Vault and will require a password to unlock and proceed.

Sanity Checking Ourselves with Serverspec

Now that we have Vault working nicely with Test Kitchen, a final step would be to add automated tests to make sure that we are indeed deploying files with the correct permissions, now and in the future. For more details on using Ansible & Test Kitchen with Serverspec, see Testing Ansible Roles with Test Kitchen. Here’s what a Serverspec test for our above files would look like:

# test/integration/default/serverspec/secret_keys_spec.rb

require 'serverspec'

# Secret keys should not be world readable.
secret_keys = [
  '/etc/openvpn/dh2048.pem',
  '/etc/openvpn/ipp.txt',
  '/etc/openvpn/openvpn.key',
  '/etc/openvpn/ta.key',
  '/etc/openvpn/easy-rsa/keys/ca.key',
  '/etc/openvpn/easy-rsa/keys/ec2-openvpn.key'
]

for secret_key in secret_keys
  describe file(secret_key) do
    it { should be_file }
    it { should be_mode 400 }
    it { should be_owned_by 'root' }
    it { should be_grouped_into 'root' }
  end
end

Deploying to Production with Jenkins

A final piece of the puzzle to figure out was how to actually run “ansible-playbook” with a code base that utilizes Ansible Vault within the context of a job-runner like Jenkins. In order words, how to provide Jenkins with the password to unlock the Vault. I found a couple of options here:

  • Put the Vault password into a locked-down file (mode 400) on your Jenkins slaves that run Ansible. This only works if your Jenkins slaves have some level of security around the users that Jenkins uses. I’m not crazy about passwords in text files, but in theory this shouldn’t be any worse than a locked-down, 400-mode file like those in “/etc/sudoers.d/…”.
  • Modify the Jenkins job that runs Ansible to require a Password parameter, run “ansible-playbook” within that job with that password parameter being echo’d in, and then use the Jenkins Mask Passwords plugin to mask the contents of that password from your build logs. The downside of this is that it complicates automated execution of the Jenkins job that invokes Ansible as it now requires a password to be invoked.
  • Store the Ansible Vault password in another secret management system like HashiCorp’s Vault. This starts to get pretty meta 🙂

Ultimately you have to decide which of these three options fits best within your infrastructure and workflow.

Conclusion

There you have it, my two-part guide to using Ansible Vault from soup to nuts. Hopefully you’ve found these notes to be useful in getting an end to end system for securely managing your infrastructure’s secrets. Please let me know in the comments if I’ve left anything out. Thanks!

ansible_logo_black_square

Managing Secrets with Ansible Vault – The Missing Guide (Part 1 of 2)

(This post is part 1/2 in a series. For part 2 see: Managing Secrets with Ansible Vault – The Missing Guide (Part 2 of 2))

Background and Introduction to Ansible Vault

Once you’ve started using Ansible to codify the configuration of your infrastructure, you will undoubtedly run into a situation where you need to manage some of your infrastructure’s “secrets”. Examples of such secrets include SSH private keys, SSL certificates, or passwords. How do you codify and automate the distribution of these secrets? By checking these secrets into a source control system or posting for review in a code review tool in plain-text, you’d be instantly making them visible to a large number of people within your organization.

Luckily Ansible has created a tool to address this: Ansible Vault. The documentation for Ansible Vault describes its easy to use interface for encrypting, decrypting, and re-keying your secrets for storing in source control. Unfortunately the documentation provides little information on best practices for how to use Ansible Vault to deploy those secrets via a playbook, how to prevent the contents of those secrets from being echoed in plain-text to STDOUT when run with “–verbose” mode (ouch!), and how to test your playbooks when they contain such encrypted secrets, and how to integrate this into Jenkins.

Having recently spent time writing an Ansible role for deploying an OpenVPN server and having had to figure out the answer to a lot of these issues, I’m now happy to present “The Missing Guide to Managing Secrets with Ansible Vault”.

Storing and Deploying Secret Files

The first mental-hurdle to overcome around deploying secret files (ex. SSH private keys) with Ansible Vault is that that one must use a totally different mechanism for deploying files than with the traditional Ansible copy mechanism. Ex: Typically one would check in non-secret files into the “files/” directory of their Ansible role, and drop those files into place on the remote host with Ansible’s “copy” module using the “src” and “dest” parameters. Easy as pie.

Things work quite differently for encrypted secret files however, as mentioned in this StackOverflow post. Instead of checking in an encrypted version of the file to the “files/” subdirectory, one must place the contents of the file into an Ansible variable and deploy that file using the “contents” arg of the copy module. Here’s a working example:

# Unencrypted version of “vars/vpn-secrets.yml”
---
vpn_secret_files:
  /etc/openvpn/easy-rsa/keys/ec2-openvpn.key:
    owner: root
    group: root
    mode: "u=r,go="
    content: |
      -----BEGIN PRIVATE KEY-----
      MIIEvAIBADANBgkqhkiG9w0BAQEFAASCBKYwggSiAgEAAoIBAQD5koXgI24E360f
      nhxCfOPVORzFW1CN7u/zOQdvKoIStogF0UQifDCnY/POEjoBmzBrg/UyAmsqLIli
      xMtRIuvEhwaGEUQPoZNCaRW+1XtJ3kDvr9MVTlJTcNGOlGe/E+HyAKBq5vinxzzM
      9ba8M9Nc1PQ93B1OTUY1QGHVYRvSFYDJ5Fnz23xKeNsnY3hmRkV7CDZXSdy9nbmy
      1X9uz7z5bG7PKUVD3JZjI75CHAEDJKtscBv9ez/z16YTxwahIL3CXfqBq8peyAZ0
      n4Mzj4Lt8Cwaw2Kw3w3gMhbhf4fy284+hYqHe9uqYJC6dJJSKDIXqoLSD+e8aN+v
      BAEQcAWXAgMBAAECggEAbmHJ6HqDHJC5h3Rs11NZiWL7QKbEmCIH6rFcgmRwp0oo
      GzqVQhNfiYmBubECCtfSsJrqhbXgJAUStqaHrlkdogx+bCmSyr8R3JuRzJerMd6l
      Jd3EJHZBnzoU1VT6Fd77Xge868tASySp1ZUPv2nEoBhn9jw2kf1HgiH5o2CR53ZP
      pnL72Ng7MHpKuyoAZ9DtUU7yGG4RTCN2JuPGD6IwKoXBs1b7tqsMncz86u6Iibwk
      Np4j3vPmSLfQxvBP85T0xzSURlnP+bFCaJDPfXYIgDLROkrFAgJ2ADCm4gwfk93i
      Z/wnk8tFjnxUy2V5UbtWqqkVHmvdHHCc/6bZfcNOsQKBgQD/v94YX3vhgZRiz1kZ
      c0v2lxFZqNgMPC7EADmO34nFq7KtmVXYQfpoiooGDfQXTqfVGQsyTcpg5HLZvlyb
      qm9oaXpZY4yP/SLF6Pc00/iDTleSxGROyqhsaBotXpqSSC3rv92D9Zas/Xdz3lHD
      NSY9EVsiFId7O4OkvLuZVDvZQwKBgQD50Rs873/yUdyCwKx9/GF4yWVRg7//FTyQ
      Cj1KCBK5tDqOc+hiIS1GF0HRkcvIot71owTe+PG9OouXlUuxWrtc+fzgGSPaYjMp
      Ub69EcSNtUsK8MUS+VADbR5VDzS27OM1g+pJO7BbHpPWuEI1cjYmW/+3cCzFYnIV
      5z6OctbjHQKBgEVQWP8+EbMijXbiP4G4T+Q7OUaVjkhynzIb5X2ldA+Q41JNdoiw
      CRAATDwr1/XhKXeF3BT8JFdyUvZUs4C1BpDD1ZcYdeYocx40b5tvv7DGsNFkTNNV
      9aO76yxUsYvn6Bo22/CBxR6Ja7CJlptTclOmuo5YBggOLzWcuTNrMvVFAoGASIoV
      lK4ewuhOVZFJBRRB4Wbpiq/tEk7CVTkD7vlFJrNUxYSWl9f2Y4HhVM83Ez1n7H+3
      rF8xIrdbTVrGresguLDGYvQp2wHkxTy9W/1Ky7M25ShgsU+/kh8fTaeqsOs8Vo/F
      ehpg7TSFzTWX1Bkj7COOr19dQLuDUSTin05tY2kCgYB35ZHVDMR6TlW0Kp/l7gAx
      FQx5hojllzHr3RRv8a4rBbhsdAJGBr5QHZbzVeuw1z6NlDc/4brer3y52FnnHbD3
      fkUrvh+g1xHeXF4Yekr5Mu2D7PoQoFRRai2hjPnIHRLmHI45EPri3USoHuNPl+qB
      l23chS70zQ9VDmqEs9gjLA==
      -----END PRIVATE KEY-----
  /etc/openvpn/easy-rsa/keys/ca.key:
    owner: root
    group: root
    mode: "u=r,go="
    content: |
      -----BEGIN PRIVATE KEY-----
      MIIEvgIBADANBgkqhkiG9w0BAQEFAASCBKgwggSkAgEAAoIBAQDPm22e2QTeTnLN
      PT//6kyB8tM/2kE6+LsFD3TFA4XvS3gwNZLybjXpPtncF4qLxjq3c4uSBp2tuAa2
      VvWUCAyQX4EcOuCFhh1AIUHX9O4F2JhLtNH366D6LmfGE7Lck85R6bzErYJ5OzBN
      /3WSGtWmLbQWhXTvNwG5re17Ds7DLQ6/XRXCg91lAbtGqYCvw9F6X8N3VNdcovqN
      Ud+tJ4XjmGfPD8ZgSk/iVKeLzz5fuNxON+ygdUJ9IQJGu7kvJOhWD1F3p3lzuS4E
      7zyR8r9QK6lGdk2/ifmY5f+tmI92fvVl2HD2DroEVp42hCYEpNogm8BKXHFHBA9N
      0mugGMzVAgMBAAECggEAAK5a2rWNjYkmWUQFLLrBC4AXb1Mw+ZeNTYPydx7+1n0h
      5M6YL9Fqvdwl7NHq83BwCuAHKjB5XfOHmhuI7LZmDCc0DjqnN+jruaUiSSoVidFf
      Foh+U9jjC08RqhWwdYbKm3wv0VlcXzdxfiADa7pIzyXBPH2tl4dPqyNF7yxqQzum
      F42D4IExbYYkGR7bP6RePrUiaO3iU/EwDL5Dey4+93K+EaxbdxIhMLclvnQ8I0tl
      tFGn4AbbOqPqzPxWZhWk2gT//jMTtJh6FxQLQkvDoEnta5UYQ2E38r33jK+Wasga
      lGZEyNOTMq1MMdPrCzXloJSnerCXC4vTFt62AOdIQQKBgQD3SvUeaXV7Xf67vL0t
      EdBG9YL0Zz2MxxoVAth44svMzQ4gR6/pkakEhMzR51I/Skl/wzCJFHY1Z4nq9DoA
      RY5APjO63uHdZEKKYZ1MTXmO6F+IkUY5MCBvyCtLsnkAcToyuyDuhV4NBfjydw6E
      L5S1H9NI7klvaPxq5I7KkzSeJQKBgQDW6sDBvi6ctV3w8GCTUjP5Ker1FuKYL7Yn
      HI6RIGnWB2hS8NbEe8ODgzsVOVnC6x+WCNBiu/GmF8wlue7PCH7rLEa8diiM+J9/
      QYXtezfLIhPqhPJZDj5IX7bIotkvUzv+ywvUfCtJ3aCAu8DMi09x1GRgU6go/4ZK
      SCmVmj588QKBgQCNhr2gCRTuZM37nbnayF4drjajL06/eddIfRdsn8epTxWtjbl0
      gCNt7Z7W5n9gr2A/GXN2kFpSmA4LhHiJXUVbKP4sDZDQRqf6UIFYgOJ30i+SlinN
      Yui9cJ6utNahVSvMiuH/AB7iby+ZfF+3cQ+3VR5zl8Q5WalUd7fs4bB0bQKBgBI1
      x+lipO5wS6pro7M35uF41Mi5jK+ac1OzDr1rQqx46jUE5R224uUUzH/K4Tkr1PxQ
      eN+0zw/kuk6EB6ERNjfVA5VaaaswMcuFkMSDiUGz/H4Fj8dN9qcJPSKY8dAZvF6l
      c7YoYz6aAcyGnBp4v12EwpCK5he7NvS6UpOzgxHxAoGBAOjiBQtwikKLzLYwg1gF
      QYh1TLvEJIRFYEFQveVUKxmSskN4W6VQrTrcqobYHM9tOSbSe+Ib/y/khpaEz0PE
      E5gxeUbxhTj0PVvOKJmyCKWDPL8o61MGVhX1nAJarfbdP1XM9fl4S3pZH14bIhOU
      FG0e4jNsDq6vdwytV9R/GyAv
      -----END PRIVATE KEY-----
...<snip>...

#######

# tasks/main.yml

#
# Use "no_log: true" to keep from echoing secrets to stdout.
# See: http://docs.ansible.com/faq.html#how-do-i-keep-secret-data-in-my-playbook
#
---
- name: VPN Server | Load VPN secret keys
  include_vars: "vpn-secrets.yml"
  no_log: true

- name: VPN Server | Copy secret files
  copy:
    dest="{{ item.key }}"
    content="{{ item.value.content }}"
    owner="{{ item.value.owner }}"
    group="{{ item.value.group }}"
    mode="{{ item.value.mode }}"
  with_dict: vpn_secret_files
  no_log: true
  notify:
    - restart openvpn

Here we see that “vars/vpn-secrets.yml” contains a multi-level hash where the first level is the destination file name (ex. “/etc/openvpn/easy-rsa/keys/ec2-openvpn.key”) and the secondary level for each filename contains respective attributes for the secret file (ex. owner, group, mode, and file contents). Those attributes are then passed straight through as args to the “copy” command which is iterating over the keys of that hash via the “with_dict: vpn_secret_files” argument.

Also note the use of “no_log: true” for both the “include_vars” and “copy” commands, above. This is necessary otherwise Ansible will echo the contents of your secret files to STDOUT when executing those commands.

So what does this look like when run with “ansible-playbook –ask-vault-pass …”?

       TASK: [dlpx.vpn-server | VPN Server | Load VPN secret keys] *******************
       ok: [localhost] => {"censored": "results hidden due to no_log parameter"}

       TASK: [dlpx.vpn-server | VPN Server | Copy secret files] **********************
       changed: [localhost] => {"censored": "results hidden due to no_log parameter", "changed": true}
       changed: [localhost] => {"censored": "results hidden due to no_log parameter", "changed": true}
       changed: [localhost] => {"censored": "results hidden due to no_log parameter", "changed": true}
       changed: [localhost] => {"censored": "results hidden due to no_log parameter", "changed": true}
       changed: [localhost] => {"censored": "results hidden due to no_log parameter", "changed": true}
       changed: [localhost] => {"censored": "results hidden due to no_log parameter", "changed": true}

       NOTIFIED: [dlpx.vpn-server | restart openvpn] *********************************
        REMOTE_MODULE service name=openvpn state=restarted
       changed: [localhost] => {"changed": true, "name": "openvpn", "state": "started"}

Hooray! Encrypted files are copied to the remote host securely. We now have a logical framework to re-use throughout our Ansible code base.

An Aside on Unix File Modes (Here be Dragons!)

I typically use the octal representation for Unix file modes instead of the string-based symbolic representation, but I had difficulty using octal representations with this deployment method. Although one could represent the file mode as an integer within the Ansible variable file, the “mode” arg to “copy” needs to have that value quoted as a string because of the double curly braces that Jinja needs to interpolate the variable. (Curly braces have a special meaning in YAML and thus need to be quoted).

One could theoretically re-cast that string back to an int() using Jinja’s “|int” filter, but I couldn’t seem to get this to work, so I eventually broke down and used symbolic file modes. Oh well, we can always write Test Kitchen tests to verify the correct permissions on these files later…

The Next Steps

Thus far we’ve covered how to use Ansible Vault to store your secrets safely in source control, and how to organize your Ansible variables/tasks to securely deploy those secrets. In Part 2 of this guide we’ll go over how to use Vault when testing with Test Kitchen, and also different ways that this could be integrated into a Jenkins job.

On to part 2 of “Managing Secrets with Ansible Vault – The Missing Guide”

ansible_logo_black_square

VMware AppCatalyst First Impressions

As previously mentioned in my DockerCon 2015 Wrap-Up, one of the more practical
announcements from last week’s DockerCon was that VMware announced a free variant of Fusion called AppCatalyst. The availability of AppCatalyst along with a corresponding plugin for Vagrant written by Fabio Rapposelli gives developers a less buggy and more performant alternative to using Oracle’s VirtualBox as their VM provider for Vagrant. vmware_cloud_logo

Here is the announcement itself along with William Lam‘s excellent guide to getting started w/AppCatalyst & the AppCatalyst Vagrant plugin.

Taking AppCatalyst for a Test Drive

One of the first things I did when I returned to work after DockerCon was to download AppCatalyst and its Vagrant plugin, and take them for a spin. By and large, it works as advertised. Getting the VMware Project Photon VM running in Vagrant per William’s guide was a cinch.

Having gotten that Photon VM working, I immediately turned my attention to getting an arbitrary “vmware_desktop” Vagrant box from HashiCorp’s Atlas working. Atlas is HashiCorp’s commercial service, but they make a large collection of community-congtributed Vagrant boxes for various infrastructure platforms freely-available. I figured that I should be able to use Vagrant to automatically download one of the “vmware_desktop” boxes from Atlas and then spin it up locally with AppCatalyst using only a single command, “vagrant up”.

In practice, I hit an issue which Fabio was quick to provide me with a workaround for: https://github.com/vmware/vagrant-vmware-appcatalyst/issues/5

The crux of the issue is that AppCatalyst is geared towards provisioning Linux VMs and not other OS types, ex. Windows. This is quite understandable as VMware would not want to cannibalize Fusion sales for folks that buy Fusion to run Windows on their Macs. Unfortunately this OS identification logic seems to be coming from the “guestos” setting in the box’s .VMX file, and apparently many of the “vmware_desktop” boxes on Altas do not use a value for that VMX key that AppCatalyst will accept. As Fabio suggested, the work-around was to override that setting from the VMX file to a value that AppCatalyst will accept.

A Tip for Starting the AppCatalyst Daemon Automatically

Another minor issue I hit when trying AppCatalyst for the first time was that I’d forgotten to manually start the AppCatalyst daemon, “/opt/vmware/appcatalyst/bin/appcatalyst-daemon”. D’oh!

Because I found it annoying to launch a separate terminal window to start this daemon every time I wanted to interact with AppCatalyst, I followed through on a co-worker’s suggestion to automate the starting of this process on my Mac via launchd. (Thanks Dan K!)

Here’s how I did it:

$ cat >~/Library/LaunchAgents/com.vmware.appcatalyst.daemon.plist <<EOF
<?xml version="1.0" encoding="UTF-8"?>
<!DOCTYPE plist PUBLIC "-//Apple//DTD PLIST 1.0//EN" "http://www.apple.com/DTDs/PropertyList-1.0.dtd">
<plist version="1.0">
  <dict>
    <key>Label</key>
    <string>com.vmware.appcatalyst.daemon</string>
    <key>Program</key>
    <string>/opt/vmware/appcatalyst/bin/appcatalyst-daemon</string>
    <key>RunAtLoad</key>
    <true/>
    <key>KeepAlive</key>
    <true/>
    <key>StandardOutPath</key>
    <string>/tmp/appcatalyst.log</string>
    <key>StandardErrorPath</key>
    <string>/tmp/appcatalyst.log</string>
  </dict>
</plist>
EOF

After logging out and logging back in, the AppCatalyst daemon should be running and its log file will be at “/tmp/appcatalyst.log”. Ex:

$ tail -f /tmp/appcatalyst.log
2015/06/30 09:41:03 DEFAULT_VM_PATH=/Users/dtehranian/Documents/AppCatalyst
2015/06/30 09:41:03 DEFAULT_PARENT_VM_PATH=/opt/vmware/appcatalyst/photonvm/photon.vmx
2015/06/30 09:41:03 DEFAULT_LOG_PATH=/Users/dtehranian/Library/Logs/VMware
2015/06/30 09:41:03 PORT=8080
2015/06/30 09:41:03 Swagger path: /opt/vmware/appcatalyst/bin/swagger
2015/06/30 09:41:03 appcatalyst daemon started.

Since AppCatalyst is still in Tech Preview, I’m hoping VMware adds this sort of auto-start functionality for the daemon before the final release of the software.

Conclusion

If you or your development team is using VirtualBox as your VM provider for Vagrant, go try out AppCatalyst. It’s based on the significantly better technical core of Fusion and if it grows in popularity maybe one day it could be the default provider for Vagrant! 🙂

DockerCon 2015 Wrap-Up

I attended DockerCon 2015 in San Francisco from June 22-23. The official wrap-ups for Day 1 and Day 2 are available from Docker, Inc. Keynote videos are posted here. Slides from every presentation are available here.

Here are my personal notes and take-aways from the conference:

The Good

  • Attendance was much larger than I expected, reportedly at 2,000 attendees. It reminded me a lot of VMworld back in 2007. Lots of buzz.
  • There were many interesting announcements in the keynotes:
    • Diogo Mónica unveiled and demoed Notary, a tool for publishing and verifying the authenticity of content. (video)
    • Solomon Hykes announced that service discovery is being added into the Docker stack. Currently one needs to use an external tools like registrator, Consul, and etcd for this.
    • Solomon announced that multi-host networking is coming.
    • Solomon announced that Docker is splitting out its internal plumbing from the Docker daemon. First up is splitting out the container runtime plumbing into a new project called RunC. The net effect is that this creates a reusable component that other software can use for running containers. This will also make it easy to run containers without the full Docker daemon as well.
    • Solomon announced the Open Container Project & Open Container Format – Basically Docker, Inc. and CoreOS have buried the hatchet and are working with the Linux Foundation and over a dozen other companies to create open standards around containers. Libcontainer and RunC are bring donated to this project by Docker, while CoreOS is contributing the folks who were working on AppC. More info on the announcement here.
    • Docker revealed how they will start to monetize their success. They announced an on-prem Docker registry with a support plan starting at $150/month for 10 hosts.
  • Diptanu Choudhury unveiled Netflix’s Titan system in Reliably Shipping Containers in a Resource Rich World using Titan. Titan is a combination of Docker and Apache Mesos, providing a highly resilient and dynamic PaaS that is native to public clouds and runs across multiple geographies.
  • VMware announced he availability of AppCatalyst, a free, CLI-only version of VMware Fusion. That software, combined with the Vagrant plugin for AppCatalyst that Fabio Rapposelli released, means that developers no-longer need to pay for VMware Fusion in order to have a more stable and performant alternative to Oracle’s VirtualBox for use with Vagrant. William Lam has written a great Getting Started Guide for AppCatalyst.
  • The prize for most entertaining presentation goes to Bryan Cantrill for Running Aground: Debugging Docker in Production. Praise for his talk & funny excerpts from that talk were all over Twitter:

The Bad

I was pretty disappointed with most of the content of the presentations on the “Advanced” track. There were a lot of fluffy talks about micro-services, service discovery, and auto-scaling groups. Besides not getting into great technical detail, I was frustrated by these talks because there was essentially no net-new content for anyone who frequents meetups in the Bay Area, follows Hacker News, or follows a few key accounts on Twitter.

Speaking to other attendees, I found that I was not the only one who felt that these talks were very high-level and repetitive. Bryan Cantrill even eluded to this in his own talk when he mentioned “micro-services” for the first time, adding, “Don’t worry, this won’t be one of those talks.”

Closing Thoughts

I had a great time at DockerCon 2015. The announcements and presentations around security and network were particularly interesting to me because there were new things being announced in those areas. I could have done w/o all of the fluffy talks about micro-services and auto-scaling.

It was also great to meet new people and catch up with former colleagues. I got to hear a lot of interesting ways developers are using Docker in their development and production environments and can’t wait to implement some of the things I learned at my current employer.

Testing Ansible Roles with Test Kitchen

Recently while attending DevOps Days Austin 2015, I participated in a breakout session focused on how to test code for configuration management tools like Puppet, Chef, and Ansible. Having started to use Ansible to manage our infrastructure at Delphix I was searching for a way to automate the testing of our configuration management code across a variety of platforms, including Ubuntu, CentOS, RHEL, and Delphix’s custom Illumos-based OS, DelphixOS. Dealing with testing across all of those platforms is a seemingly daunting task to say the least!

Intro to Test Kitchen

The conversation in that breakout session introduced me to Test Kitchen (GitHub), a tool that I’ve been very impressed by and have had quite a bit of fun writing tests for. Test Kitchen is a tool for automated testing of configuration management code written for tools like Ansible. It automates the process of spinning up test VMs, running your configuration management tool against those VMs, executing verification tests against those VMs, and then tearing down the test VMs.

What’s makes Test Kitchen so powerful and useful is its modular design:

Using Test Kitchen

After learning about Test Kitchen at the DevOps Days conference, I did some more research and stumbled across the following presentation which was instrumental in getting started with Test Kitchen and Ansible: Testing Ansible Roles with Test Kitchen, Serverspec and RSpec (SlideShare).

In summary one needs to add three files to their Ansible role to begin using Test Kitchen:

  • A “.kitchen.yml” file at the top-level. This file describes:
    • The driver to use for VM provisioning. Ex: Vagrant, AWS, Docker, etc.
    • The provisioner to use. Ex: Puppet, Chef, Ansible.
    • A list of 1 or more operating to test against. Ex: Ubuntu 12.04, Ubuntu 14.04, CentOS 6.5, or even a custom VM image specified by URL.
    • A list of test suites to run.
  • A “test/integration/test-suite-name/test-suite-name.yml” file which contains the Ansible playbook to be applied.
  • One or more test files in “test/integration/test-suite-name/test-driver-name/”. For example, when using the BATS test-runner to run a test suite named “default”: “test/integration/default/bats/my-test.bats”.

Example Code

A full example of Test Kitchen w/Ansible is available via the delphix.package-caching-proxy Ansible role in Delphix’s GitHub repo. Here are direct links to the aforementioned files/directories:682240

Running Test Kitchen

Using Test Kitchen couldn’t be easier. From the directory that contains your “.kitchen.yml” file, just run “kitchen test” to automatically create your VMs, configure them, and run tests against them:

$ kitchen test
-----> Starting Kitchen (v1.4.1)
-----> Cleaning up any prior instances of 
-----> Destroying ...
 Finished destroying  (0m0.00s).
-----> Testing 
-----> Creating ...
 Bringing machine 'default' up with 'virtualbox' provider...
 ==> default: Importing base box 'opscode-ubuntu-14.04'...
==> default: Matching MAC address for NAT networking...
 ==> default: Setting the name of the VM: kitchen-ansible-package-caching-proxy-default-ubuntu-1404_default_1435180384440_80322
 ==> default: Clearing any previously set network interfaces...
 ==> default: Preparing network interfaces based on configuration...
 default: Adapter 1: nat
 ==> default: Forwarding ports...
 default: 22 => 2222 (adapter 1)
 ==> default: Booting VM...
 ==> default: Waiting for machine to boot. This may take a few minutes...

..  ...

-----> Running bats test suite
 ✓ Accessing the apt-cacher-ng vhost should load the configuration page for Apt-Cacher-NG
 ✓ Hitting the apt-cacher proxy on the proxy port should succeed
 ✓ The previous command that hit ftp.debian.org should have placed some files in the cache
 ✓ Accessing the devpi server on port 3141 should return a valid JSON response
 ✓ Accessing the devpi server via the nginx vhost should return a valid JSON response
 ✓ Downloading a Python package via our PyPI proxy should succeed
 ✓ We should still be able to install Python packages when the devpi contianer's backend is broken
 ✓ The vhost for the docker registry should be available
 ✓ The docker registry's /_ping url should return valid JSON
 ✓ The docker registry's /v1/_ping url should return valid JSON
 ✓ The front-end serer's root url should return http 204
 ✓ The front-end server's /_status location should return statistics from our web server
 ✓ Accessing http://www.google.com through our proxy should always return a cache miss
 ✓ Downloading a file that is not in the cache should result in a cache miss
 ✓ Downloading a file that is in the cache should result in a cache hit
 ✓ Setting the header 'X-Refresh: true' should result in a bypass of the cache
 ✓ Trying to purge when it's not in the cache should return 404
 ✓ Downloading the file again after purging from the cache should yield a cache miss
 ✓ The yum repo's vhost should return HTTP 200

 19 tests, 0 failures
 Finished verifying  (1m52.26s).
-----> Kitchen is finished. (1m52.49s)

And there you have it, one command to automate your entire VM testing workflow!

Next Steps

Giving individual developers on our team the ability to quickly run a suite of automated tests is a big win, but that’s only the first step. The workflow we’re planning is to have Jenkins also run these automated Ansible tests every time someone pushes to our git repo. If those tests succeed we can automatically trigger a run of Ansible against our production inventory. If, on the other hand, the Jenkins job which runs the tests is failing (red), we can use that to prevent Ansible from running against our production inventory. This would be a big win for validating infrastructure changes before pushing them to production.

ansible_logo_black_square